|

| GENERAL |
MEDICAL IMAGING GROUP
UCL and UCL Hospital
Laser Surface Scanning 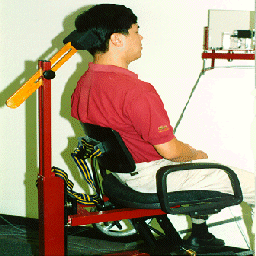 Fig. 1 The MGI laser scanner. The patient sits on a chair which is rotated under computer control. A low-power laser line illuminates the face and is viewed by a camera from 2 different directions. Acquisition takes a few seconds, generating large numbers of measured points. 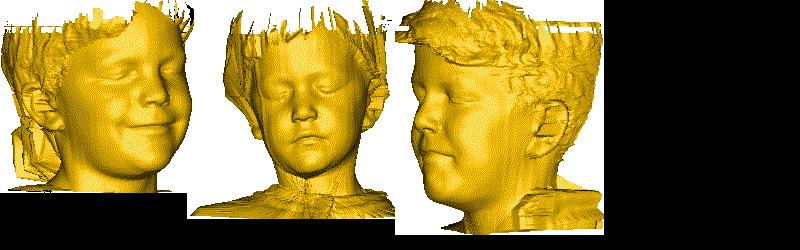 Fig. 2 Fig. 2These are 3 children, volunteers in a long term normal growth study. These images can of course be viewed from any angle and compared with earlier and later images. The low res image is poorly rendered on my browser. Click image for larger image. Some details: Surface colouring is not recorded, colour and shading is artificial, based on a lighting model. Dark hair is usually not registered. Vertical ridges are motion artifacts. 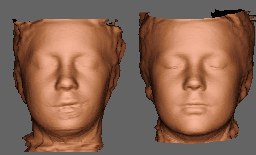 Fig. 3 Views of 2 sets of averaged faces: L:cranio-facial microsomia males aged 9-12; R normal controls 9-12. For more details of a clinical study relating to this, see Tricia Goodwin's PhD Poster:The Effect Of Surgery On The Facial Morphology Of Patients With Hemifacial Microsomia. 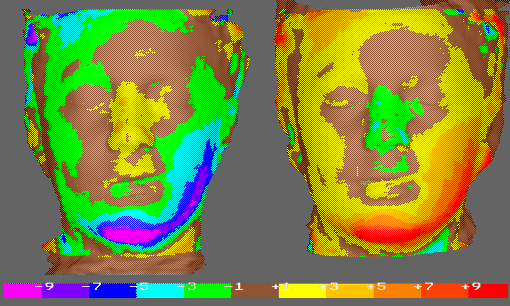 Fig. 4 The same cranio-facial microsomia average study as the previous image, colour coding the dimensional differences. Since the scale uses + and - radial distances, the differences are complementary. A deficiency in the soft tissues post surgery is clearly visible and measurable. Colour bands are 2mm apart. Brown is less than 1 mm difference. Problems involving lateral asymmetries can be displayed and measured using the process of L-R reversal. |
|---|