|
A guide to Fabry-Perot polymer film ultrasound detection
Principles of
operation | Sensitivity | Linearity
| Frequency
response | Effective
element size
Principles of operation
Figure 1(a) shows a schematic of
a Fabry-Perot polymer film ultrasound transducer. A discrete polymer film such as PET
(polyethyene terephthalate) or one that is deposited on to a substrate such as
Parylene can be used as the sensing element. The thickness of the polymer film
depends up the bandwidth required and backing configuration but is typically of
the order of 25-50µm for bandwidths in the tens of MHz range. The mirrors of the
interferometer can be formed by depositing metallic or dielectric reflective coatings
or for certain applications [1,2] left uncoated with the refractive index mismatch
between the film and surrounding media providing the necessary Fresnel reflections.
The transduction mechanism [3] comprises two processes. Firstly, assuming the elastic limits
of the polymer sensing film are not exceeded, external acoustic pressure is linearly converted
to a change in the optical thickness of the film (fig 1(a)). Secondly, the resulting optical
phase shift is converted to an intensity (figure 1(b)) modulation through the intensity-phase
transfer function of the interferometer. The latter is not strictly linear although by setting
the phase bias appropriately (see figure 2(b)) by tuning the laser wavelength, small phase
shifts can be detected with acceptable linearity.
Figure 1
(a) Fabry-Perot polymer film ultrasound sensor and (b) low finesse Fabry-Perot
interferometer transfer function.
Note that figure 1(b) shows the raised cosine transfer function
characteristic of a two beam interferometer. In a F-P cavity, this occurs when the
reflectivities of the cavity mirrors are small (<10%). In this case the contribution
of multiple reflections to the reflected fringe system can be neglected and the interferometer becomes one of low finesse. Whilst higher sensitivity can be achieved using
high reflectivity low absorption dielectric mirrors to create a high finesse F-P cavity,
there are several important practical advantages to the low finesse configuration.
It offers reasonable detection sensitivity, comparable to PVDF transducers and a useful
linear phase range with the detection of phase shifts up to 0.8 rad
achievable with a
linearity
of better than 10%. An optimum fringe visibility close to unity can be achieved with
a relatively wide range mirror reflectivities reducing the requirements of the optical
coating process. Furthermore, the wavelength tuning range and stability requirements
for the laser source are relatively relaxed compared to those for a high finesse cavity.
Back to top
Sensitivity
To formalise the description of sensitivity it is helpful to define figures of merit for each transduction process
[3]. The
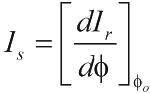
phase sensitivity Is represents the slope efficiency of the conversion of optical phase
df to
intensity output dIR and is defined as the optical power modulation per unit phase shift
(mW/rad) at the phase bias
fo
(figure 1b).
 (1)
(1)
Thus Is is dependent upon the incident laser power and the reflectivity
and absorbance characteristics of the reflective coatings that form the mirrors of the
interferometer. With knowledge of the detector noise floor, Is
can be used to determine
the phase resolution of the interferometer - mrad phase noise floors over a 25MHz
measurement bandwidth with low finesse cavities have been reported [3,4].
The acoustic phase sensitivity
As represents the conversion of external acoustic pressure to an
optical phase shift. It is defined as magnitude of the optical phase shift produced
per unit acoustic pressure (rad/MPa). It is thus a measure of the acoustically-induced
change in optical thickness of the sensing film - the change in both physical thickness
and refractive index and is dependent on the elastic and photoelastic properties of the
cavity. It is given by 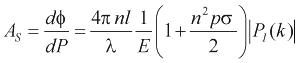 (2) (2)
where n is the refractive index,
l is the thickness of the film, l the laser wavelength,
E the Young's modulus, p the photoelastic constant, s Poisson's ratio. k is the acoustic wavenumber, k=2p/la where la
is the acoustic wavelength.
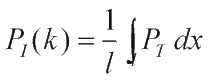
PI(k) is a frequency-dependent modifying term (discussed further in the
frequency response section) representing the net stress integrated across the thickness of the sensing film and is dependent upon the acoustic properties of the film, the backing material and the surrounding media (usually water). In the low frequency limit where la
>>
l, assuming the acoustic impedance mismatch between the sensing film and the surrounding fluid is small,
|P(k)| is dominated by the acoustic properties of the backing material. At low frequencies,
|P(k)| = 0 for a compliant backing such as air, |P(k)|
~ 1 for a backing of similar acoustic impedance such as water or a polymer and
|P(k)| ~ 2 for a rigid backing such as glass. In this paper, the low
frequency limit is implied when discussing acoustic phase sensitivity for a particular
backing configuration.
The acoustic phase sensitivity enables (with knowledge of the form of
the interferometer transfer function (ITF)) the acoustic pressure range over which the sensor is linear to be estimated
and comparisons to be made between the intrinsic sensitivity of different sensing
film materials, thicknesses and backing configurations. Typical values for
As for
50µm thick water-backed polymer films at 850nm are 0.1 rad/MPa for PET
[3] and
0.075rad/MPa for Parylene [4]. For a low finesse cavity, this gives an upper limit
of linear (<10%) detection of 10MPa and a dynamic range of 60dB. The product of Is and
As gives the overall sensitivity. In principle,
this could be optimised through
As by selecting a polymer with appropriately high
values of p and E. In practice, this is problematic due to the paucity of data available
in the literature for these parameters at ultrasonic frequencies. Additionally, the
selection of the polymer film tends to be dominated more by considerations of
uniformity of thickness, surface finish and optical clarity than its mechanical/elastic
properties. To optimise sensitivity it is more fruitful to consider the detector noise
floor and the characteristics of the interferometer transfer function.
With a wideband (tens of MHz) silicon
photodiode-transimpedance amplifier detector configuration, the output system noise
tends to be dominated by a combination of the amplifier input noise voltage and the
shot noise due to the photocurrent arising from the (large) dc interferometer output
level IR. 0.05µW noise-equivalent powers are typical although there is the potential
for some improvement on this by reducing the amplifier input noise voltage. Greater
scope for improving sensitivity lies in optimising the interferometer transfer function.
For a low finesse configuration, it is desirable to design for a fringe visibility of
unity and operate at a laser power such that the output dc level IR is just below the
saturation threshold of the detector. 10kPa noise equivalent pressures (over a 25MHz
measurement bandwidth), comparable to PVDF transducers are readily achieved with such
a configuration. To improve upon this requires the design of a high finesse cavity to sharpen the transfer function. At least an order of magnitude increase in sensitivity
should be possible albeit with a reduced upper limit of linear detection. Additionally,
an increased wavelength tuning range is required in order to avoid the 2p radians of "dead space" between the resonant peaks of ITF where sensitivity is zero. Higher
wavelength stability is also necessary to hold the system at the optimum phase bias. Back to top
Linearity
Assuming the elastic limits of the polymer film are not exceeded, the
upper limit of linear acoustic detection is determined by the characteristics of the
interferometer transfer function. The analysis is simplest for a low finesse
interferometer which has a characteristic raised sinusoidal transfer function.
At the quadrature point, phase shifts up to 0.5rad can be resolved with a linearity
of better than 5% and using the acoustic phase sensitivity this can be converted to
acoustic pressure. So for a 25µm rigid backed Parylene film with an acoustic phase
sensitivity of 0.075rad/MPa, linear operation to 7MPa can be expected as shown in
figure 2 [4]. If a reduced linearity of 10% can be tolerated, in upper limit of 11MPa
and a dynamic range of 60dB will be obtained.
Figure 2 Linearity of an
optical fibre hydrophone employing a 25 µm thick Parylene sensing film (rigid-backed) [4].
Predicted curve is based upon measured acoustic phase sensitivity of
0.075 rad/MPa and
the assumption of a low finesse Fabry Perot sensing cavity. The dotted vertical lines
shows the acoustic pressure at which the sensor nonlinearity becomes 5% and 10%.
Back to top
Frequency response
For a sensing film of sufficiently large lateral dimensions, radial
resonance modes and the effects of acoustic diffraction at the boundaries of the film
can be neglected. The sensor is then said to operate in thickness mode. The frequency
response Pl(k) depends upon the spatial variation of acoustic pressure
PT due to the
incident acoustic wave and its reflection within the film arising from the acoustic
impedance mismatch at its boundaries. Pl(k) is obtained by evaluating the mean
distribution of stress across the thickness l of the film as a function of frequency
[3].
 (3)
(3)
where k is the acoustic wavenumber. The thickness of the sensing film
in relation to the acoustic wavelength determines the bandwidth. The acoustic impedance
mismatches at the boundaries of the film, on one side due to the backing, on the other
due to water determines the uniformity of response. In general, polymer films have an
acoustic impedance close to water and the uniform broadband response characteristics
of a low Q system can be expected.
Figure
3 Acoustic reflections within sensing film.
Figure 4 shows the experimentally
measured frequency response of three physically useful configurations [3]. In each case
50 µm thick PET sensing films were used. The water backed configuration shows the small
l/2 thickness mode resonance (at ~20MHz) characteristic of a water backed polymer film
- a similar response can be observed with PVDF membrane hydrophones. For the glass backed
sensing film, which approximates to a rigid backed configuration, ( |P(k)|
= 2) and the
bandwidth is reduced by a factor of 2 with a l/4 resonance at approximately
9 MHz. The
resonance is at a slightly lower frequency than it should be due to bandlimiting effect
of the adhesive layer (~1.5 µm) between the sensing film and glass backing. In the
PMMA-backed configuration, the acoustic impedance of the PET sensing film, adhesive
layer and PMMA backing are very similar (~3 x 10⁶ kg/m2
s). Thus there is no resonance
and the response rolls off with increasing frequency.
Figure 4 Experimentally measured frequency responses of three different backing configuration using 50µm PET
sensing film [3]. The continuous lines show the predicted response calculated using equation 3.
Back to top
Effective element size
The effective element size is a measure of the acoustic aperture of a
receiver. Its effect on lateral spatial resolution makes it a key parameter in an
ultrasonic measurement and imaging system. It is of particular importance for an
ultrasound field characterisation tool such as a hydrophone or in phased array systems
where the requirement is for each element to have a near isotropic directional response
requiring the element size to be small in relation to the acoustic wavelength. To a
first approximation, the element size of the FP polymer film sensing concept is defined
by the dimensions of the optical field addressing the film. Thus, in principal, element
sizes down to the optical diffraction limit of a few microns are feasible offering the
prospect of an omni-directional response at acoustic frequencies as high as 50MHz. This
can be achieved without compromising sensitivity as, unlike piezoelectric transducers,
sensitivity is independent of element size for a given optical intensity.
Clearly there will be a limit to the assumption that the active area
is defined only by the region that is optically addressed. Acoustically-induced
thickness deformations outside the optically defined area of an element will,
to some extent, contribute to its output increasing the acoustic aperture. This
effect can be assessed by measuring the directional response of the element as a
function of acoustic frequency. By fitting the first order Bessel function of the
angular response of a circular plane piston in a rigid baffle to the experimental
data, the effective radii at each frequency can be determined. This has been studied
in a previous paper [4] by illuminating a polymer sensing film with the output of a
6µm core diameter single mode optical fibre. Directivity measurements at several
frequencies are shown in figure 5(a) illustrating low directional sensitivity to
10 MHz.
The corresponding effective radii at 1 MHz intervals to 10 MHz are shown in figure 5(b).
In common with piezoelectric PVDF receivers, the effective radii falls off with
frequency. This is thought to be due to the apodised response of the sensor arising
from the Gaussian profile of the output of the single mode optical fibre. Beyond
10 MHz, where the effective radii (not shown in fig 5(b)) would be expected to level
out a value close to optically defined element size, the effects of acoustic
diffraction around the tip of the fibre were found to distort the directivity
plots making it impossible to recover the effective radius. Thus it is difficult
to say categorically what eventual minimum effective radius would be. However,
from the measurements below 10 MHz the effective radius is (at worst) estimated
at 35 µm and is quite possibly significantly lower.  
Figure 5 (a)
Directional response of FP polymer film transducer illuminated with the
output of a 6µm core single mode optical fibre (b) Effective radius as
a function of frequency. [4]
Back to top
|