| A gastrinoma metastasis to
the liver |
![[.gif 10kb]](lv414prm.gif)
|
![[.gif 22kb]](lv414inm.gif)
|
| Pre-contrast agent injection:
Power
Doppler blood flow signals (red branches) around and within the lesion
(blue mass) were only partially visualised [AVI
439 KB]. |
Post-contrast agent injection: Blood
flow signals
around and within the lesion were significantly enhanced and the
spatial
distribution was clearly visualised [AVI 548 KB]. |
|
|
| The threshold is set to display the
vasculature only
[AVI
507 KB]. |
CT images show less striking enhancement with
a homogeneous
distribution (red-dotted area) [AVI 652 KB].. |
| A colonic metastasis to the
liver |
|
|
| 3D US enhancement [AVI
506 KB]. |
3D CT enhancement showing the same
distribution pattern
[AVI
484 KB]. |
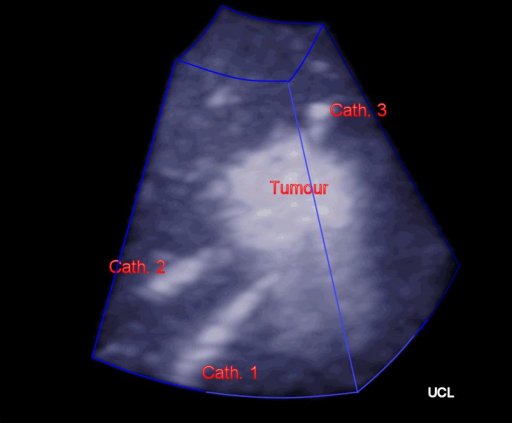
| A lung squamous cell
metastasis to
the liver |
|
|
| Left: tumour and vessels
displayed
together; right: only vessels displayed. As the vessel surface
area
(VSA), vessel volume (VV) and lesion volume (LV) are measurable on
these
3D images, we introduced the following three parameters for quantifying
tumour vascularity: VSA / VV, VSA / LV and VSA / ( LV - VV ) (click here
for reference to this). |